You must cCreate an account to continue watching
Register to access this and thousands of other videos
Try Study.com, risk-free
As a member, you'll also get unlimited access to over 88,000 lessons in math, English, science, history, and more. Plus, get practice tests, quizzes, and personalized coaching to help you succeed.
Get unlimited access to over 88,000 lessons.
Try it risk-freeAlready registered? Log in here for access
BackAlready registered? Log in here for access
 Jump to a specific example
How to Determine the Average Acceleration of an Object Using a Velocity vs. Time Motion Diagram
Step 1: Look at the diagram and locate the first and last point. The first point will represent initial velocity and time, while the last point will represent final velocity and time.
Step 2: Insert these values into the formula shown below and determine the average acceleration.
What is a Motion Diagram?
A motion diagram is a visual representation of an object's motion. In a velocity vs. time motion diagram, the x axis will represent time in seconds and the y axis will represent velocity in meters per second.
The following examples demonstrate how to determine the average acceleration of an object by using a velocity vs. time motion diagram.
Example 1
In this example, we will look at the following velocity vs. time motion diagram.
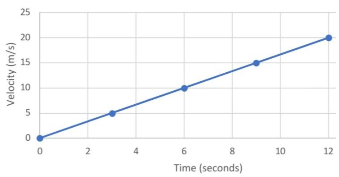 |
From this diagram, we can see that the first point is (0,0), indicating that the object must have started from rest. This tells us that both initial velocity and time are zero. The additional 4 points indicate that the object increased its speed by 5 m/s every 3 seconds for 12 seconds, thus providing the final point of (12,20). We can use the final and initial points to determine the object's average acceleration. The average acceleration is equal to the change in velocity over the change in time, as seen in the formula below.
{eq}a_{(average)}=\frac{\Delta v}{\Delta t} {/eq}
Using this formula, we can insert the values we have and solve. We know that both initial velocity and initial time are zero because the object was at rest. The final velocity was determined to be 20 m/s at 12 seconds, which is the final time. Therefore, if we plug in the numbers, we will get
{eq}a_{(average)}=\frac{20-0}{12-0} m/s^{2} = 1.67 m/s^{2} {/eq}
Example 2
Let's try another example and use the following velocity vs. time motion diagram.
 |
From this diagram, we can see that the object is decelerating because its velocity is decreasing over the course of 30 seconds. We can also tell that the object's velocity is decreasing by 40m/s every 10 seconds. Based on this diagram, we see that the first point is (0,120) and the final point is (30,0). Using these points and the formula for average acceleration, we can insert the values and calculate the acceleration.
{eq}a_{(average)}=\frac{0-120}{30-0} m/s^{2} = -4 m/s^{2} {/eq}
As the answer is negative, do not be alarmed as it makes perfect sense since the object is decelerating and slowing down.
Example 3
In this example, we are going to use the following diagram.
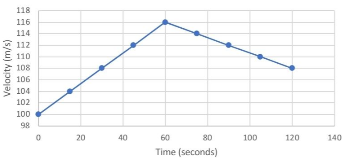 |
From the diagram, we can tell that the object is accelerating from 0 to 60 seconds but then begins to decelerate until it reaches 120 seconds. Now do not panic because the object is both accelerating and decelerating all within one time frame. Based on this diagram, we can see that the first point is (0,100) and the final point is (120,108). Using these points and the formula for average acceleration, we can insert the values and solve for the acceleration.
{eq}a_{(average)}=\frac{108-100}{120-0} m/s^{2} = 0.067 m/s^{2} {/eq}
Based on this diagram, we were able to calculate the average acceleration regardless of the object accelerating and decelerating within the time frame. All you need to remember is that as long as you have the initial and final point , you can solve for average acceleration. The points in between do not play a role for determining average acceleration but are more of a visual to help see how the object moves.