Learn the definition of the Markov chain, understand the Markov chain formula, and discover the use of Markov chain applications through examples.
Markov Chain | Formula, Application & Examples
Table of Contents
- What is Markov Chain?
- Types of Markov Chain
- Markov Chain Formula
- Markov Chain Applications
- Markov Chain Examples
- Lesson Summary
Frequently Asked Questions
How do you define a Markov chain?
A Markov chain is a modeling tool used to predict a system's state in the future. In a Markov chain, the state of a system is dependent on its previous state. However, a state is not influenced by those prior to the preceding state.
What is Markov chain used for?
Markov chains are modeling tools. They are used to predict the state of a system at a given number of steps in the future given a set of known probabilities.
Table of Contents
- What is Markov Chain?
- Types of Markov Chain
- Markov Chain Formula
- Markov Chain Applications
- Markov Chain Examples
- Lesson Summary
Theresa designs the monthly menu's appearance for a school cafeteria. She notices that there are trends between a day's main course and the main course of the previous day. For instance, chicken nuggets are more likely to be followed by meatloaf, but spaghetti never comes after fish sticks. Usually, Theresa must wait for the schedule to arrive from the caterer before she can begin the month's menu design. However, after seeing that there are trends between lunch options, Theresa wonders if she could create an algorithm to predict future monthly menus.
Theresa should consider using a Markov chain. Developed by Andrei Andreevich Markov, a Markov chain is a model that simulates the outcomes of multiple events in a series. Markov chains depend on known probabilities between states. A state is any potential outcome of an event, and the probability of one state transitioning into another state is based on prior knowledge. For instance, Theresa would need to put past menus into her model to generate the probability of one menu option leading to another. Without this background knowledge, her model would not know that transitioning from chicken nuggets to meatloaf is more probable than transitioning from chicken nuggets to spaghetti.
 |
While Markov chains can be helpful modelling tools, they do have limitations. For instance, systems that have many potential states may be too complex to realistically compute. In addition, while the model is based off prior knowledge, it may not accurately reflect what's really taking place because intermediate or hidden states may exist which lack appropriate data.
Markov Chain Explanation
Markov chains emphasize the probability of transitions between one state and another. In a Markov chain, each event's outcome is dependent only on the outcome of the event directly before it. In the case of Theresa's menu, Wednesday's lunch would depend on Tuesday's lunch, not Monday's. Because they are only focused on one transition at a time, they are memoryless. This means that they don't consider any previous transitionary probabilities to determine the outcome of a single event.

Your next lesson will play in
10 seconds
Markov chains can be classified in numerous ways. Two common categories for classifying Markov chains include:
- Discrete-time Markov chains (DTMCs)
- Continuous-time Markov chains (CTMCs)
DTMCs considers all states within a system to remain within their state for a single unit of time. In Theresa's example, menu items transition daily. DTMCs are easier to conceptualize because they move in a step-like pattern.
CTMCs do not restrict states to remain in their current form for a set amount of time. If this were the case for the school menu, chicken nuggets could remain the main course for an indefinite amount of time prior to transitioning to something else.
Markov chains generate transition matrices. These matrices have the same number of rows and columns which represent the number of states within a system. The values represent the probability of transitioning from a given row state to a column state. For instance, the rows in the following matrix represent the starting states of chicken nuggets, meatloaf, spaghetti, and fish sticks from top to bottom and the transitioned states of the same order from left to right:
{eq}P=\begin{bmatrix} 0 & 0.6 & 0.4 & 0\\ 0.5 & 0 & 0.5 & 0\\ 0 & 0 & 0 & 1 \\ 1 & 0 & 0 & 0 \end{bmatrix} {/eq}
In the given matrix, the probability of transitioning between chicken nuggets to spaghetti is 0.4. State vectors are probability vectors generated for Markov chains after a given number of steps ({eq}v_{n} {/eq}). If the Markov chain begins on a day where chicken nuggets are being served, then the initial state vector ({eq}v_{0} {/eq}) is as follows:
{eq}v_{0}=\begin{bmatrix} 1\\ 0\\ 0\\ 0 \end{bmatrix} {/eq}
Using state vectors and the following formula, it's possible to generate the probability that a system is in a given state after {eq}n {/eq} steps:
{eq}V_{n}=v_{0}P^{n} {/eq}
In this formula, P represents the transition matrix. For 5 steps, the formula would appear as such for the 4 lunch options:
{eq}V_{5}=\begin{bmatrix} 1\\ 0\\ 0\\ 0 \end{bmatrix} \begin{bmatrix} 0 & 0.6 & 0.4 & 0\\ 0.5 & 0 & 0.5 & 0\\ 0 & 0 & 0 & 1 \\ 1 & 0 & 0 & 0 \end{bmatrix}^{5} {/eq}
The use of a Markov Chain is beneficial to multiple fields of study. For instance, Markov chains have important applications in:
- Science
- Information Theory
- Queueing Theory
- Statistics
- Sports and Music
Below, these examples are explained in more detail to illustrate how Markov chains are interdisciplinary modeling tools.
Markov Chain in Science
Markov chains have a particularly important role in the physical sciences. In biology, Markov chains are often used to depict life cycles within an ecosystem. For instance, at any given state, an animal has the probability of aging to another year or dying. By understanding these probabilities, biologists can predict trends in population fluctuations over time.
In chemistry, Markov chains can be used to predict the state of a reaction at a particular step. CTMC are especially helpful in chemistry fields, as the amount of time reactants remain in a given state may not always be consistent. In physics, Markov chains are used to predict the series of events within a system in accordance with the laws of thermodynamics.
Markov Chain in Information Theory
Information theory is interested in how messages are transmitted between parties. Shannon Claude found that patterns in language often follow Markov chains, where a letter's likelihood of appearance is dependent on the letter that comes before it. Using a simple Markov chain and random letters, Claude was able to produce strings of letters that more closely resembled English words and phrases.
Markov Chain in Queueing Theory
Queue theory investigates patterns in queueing processes. For instance, how might a patient be moved from lobby to an exam room, to a pharmacy, and finally a checkout counter while reducing the amount of wait time and maintaining a high level of patient satisfaction? Queue theory employs Markov chains to provide probabilities for the number of customers occurring within a queue to determine areas lacking efficiency
Markov Chain in Statistics
Because Markov chains deal with probabilities, they provide important insights in statistics. Markov chains are common tools in Bayesian statistics, where results are depicted in probabilities and likelihoods as opposed to the p-value often used in frequentist statistics.
Markov Chain in Sports and Music
In sports, Markov chains can be used to make predictions about the outcome of a game given a current score. If a game is played to 20 points and one player has 15 points while another player has 6, there is still a possibility that either player could win, as neither has acquired 20 points. However, based on the score, a Markov chain can produce a probability that one player will win over another.
Computers have been able to generate music using Markov chains. A song can be given to a computer as prior knowledge. The chord progression, pitch, and beats are used to predict probabilities of moving from one state (for instance, an "A" chord) to another (such as a "B" chord). Based on the original piece of music, Markov chains can simulate another piece of music with a similar sound.
There are several common Markov chain examples that are utilized to depict how these models work. Two of the most frequently used examples are weather predictions and board games. Below, these examples are explored in more detail to illustrate their application.
Predicting the Weather
Weather prediction models are simple examples of how Markov chains work. Consider that the weather one day depends on the weather before. If the weather is sunny, the probability of having sunny weather the next day is 0.7 and 0.3 for rainy weather. A Markov chain can be constructed to predict the probability of weather a given number of days in the future given the current weather.
Board Games
Board games are another real-world example of a Markov chain. Consider the game Monopoly. In the game, the space you land on is dependent on the space you are on. A player moves by rolling two dice. The probability of rolling a 12 is low, as the player must roll 2 sixes. However, the probability of rolling a 6 is much higher, as a player could roll a 4 and a 2, double 3's, a 5 and a 1, and so on. Thus, the probability of landing on a space depends on the original starting point.
A Markov chain is a modeling tool that is used to predict the state (or current status or condition) of a system given a starting state. In a Markov chain, the outcome of a state depends on the state before it. However, states are not dependent on states earlier than the immediately preceding state. The probability of a state transitioning into another state is derived from previous knowledge and can be used to generate transition matrices. In a transition matrix, the rows indicate the starting state, and the columns indicate the transitioned state. The value shared by a row in column is the probability of that row's state transitioning into that column's state. The probability of a state at a known number of steps in the future can be determined using the following equation, where {eq}v_{n} {/eq} is the state vector (probabilities of any given state) at n steps in the future, P is the generated probability matrix, and {eq}v_{0} {/eq} is the original state:
{eq}V_{n}=v_{0}P^{n} {/eq}
Markov chains may be discrete-time Markov chains (DTMC) when each step is constrained to a specific unit of time. When steps are not constrained to a given unit of time or equal among transitions, Markov chains are considered continuous-time Markov chains (CTMC).
Video Transcript
Definition of Markov Chain
When we study a system that can change over time, we need a way to keep track of those changes. A Markov chain is a particular model for keeping track of systems that change according to given probabilities. As we'll see, a Markov chain may allow one to predict future events, but the predictions become less useful for events farther into the future (much like predictions of the stock market or weather). This lesson requires prior knowledge of matrix arithmetic.
A state is any particular situation that is possible in the system. For example, if we are studying rainy days, then there are two states:
- It's raining today.
- It's not raining today.
The system could have many more than two states, but we'll stick to two for this small example.
The term Markov chain refers to any system in which there are a certain number of states and given probabilities that the system changes from any state to another state. That's a lot to take in at once, so let's illustrate using our rainy days example. The probabilities for our system might be:
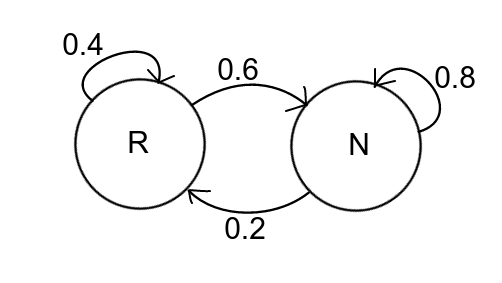
- If it rains today (R), then there is a 40% chance it will rain tomorrow and 60% chance of no rain.
- If it doesn't rain today (N), then there is a 20% chance it will rain tomorrow and 80% chance of no rain.
It may help to organize this data in what we call a state diagram. In this diagram appearing here, the left circle represents rain (R), and the right represents no rain (N). The arrows indicate the probability to change state. For example, the arrow from R to N is labeled 0.6 because there is a 60% chance that if it rains today, then it won't rain tomorrow.
 |
The Transition Matrix
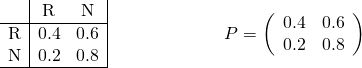
If a Markov chain consists of k states, the transition matrix is the k by k matrix (a table of numbers) whose entries record the probability of moving from each state to another state (in decimal form rather than percentage). The rows of the matrix correspond to the current state and columns correspond to the next state. For example, the entry at row 1 and column 2 records the probability of moving from state 1 to state 2. (Note, the transition matrix could be defined the other way around, but then the formulas would also be reversed.)
Let's build a transition matrix together. First, we choose an order for our states. Let's say R always comes before N. That means the first row and first column will concern R while the second row and column will concern N. Remember, rows mean ''from'' and columns mean ''to.''
As we can see here, the transition from R to R is 0.4, so we put 0.4 in the upper left of the matrix. The transition from R to N is 0.6 (upper right). N to R is 0.2 (lower left) and N to N is 0.8 (lower right).
 |
State Vectors
At the start of the process, we might know exactly which state the system is in (rain or no rain), but starting with the second state and further, we only know probabilities of the system being in any given state. To keep track of these probabilities, we use a state vector.
A state vector is a vector (i.e., list) that records the probabilities that the system is in any given state at a particular step of the process.
For example, if we know for sure that it's raining today, then the state vector for today will be (1, 0). But tomorrow is another day! We only know there's a 40% chance of rain and 60% chance of no rain, so tomorrow's state vector is (0.4, 0.6).
But what about the day after tomorrow? Or the day after that? Using matrix arithmetic, we can find the state vector for any step in the Markov process.
Main Formula
If P is the transition matrix, and v0 is the initial state vector, then the state vector after n steps is, as we can see here:
 |
Now that we know the basics, let's really dig into that rainy day example. Suppose it's raining today. Then what's the probability of rain each day for the next five days?
The initial vector will be (1, 0). Tomorrow (n = 1 day later), the state vector is as follows:
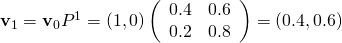 |
Continue for each day after and we get all of these results:
 |
These results are summarized in this table appearing here:
| Day n After Today | Chance of Rain |
|---|---|
| 0 | 100% |
| 1 | 40% |
| 2 | 28% |
| 3 | 25.6% |
| 4 | 25.1% |
| 5 | 25 % |
Long-Term Predictions
After a number of steps, the probabilities seem to converge onto a constant value regardless of the day. For example, on days three, four, and five in the previous example, the chance of rain approaches 25%.
It may be surprising that the same behavior happens even with a different initial state vector. Suppose it isn't raining today, so that v0 = (0, 1). Let's run the calculations again, the results of which you can see appearing here:
| Day n After Today | Chance of Rain |
|---|---|
| 0 | 0% |
| 1 | 20% |
| 2 | 24% |
| 3 | 24.8% |
| 4 | 25% |
| 5 | 25 % |
The long-term behavior of the system is 25% of rain, regardless of the initial state. So this model may be useful only for short-term predictions. Keep your umbrella handy!
Lesson Summary
All right, let's now take a moment or two to review. A Markov chain is a system that changes from state to state according to given probabilities, where a state is any particular situation that's possible in the system. The transition matrix is a k by k matrix (table of numbers) whose entries record the probability of moving from each state to another state (in decimal form, rather than percentage). And the list of probabilities that the system is in any given state after some number of steps is called a state vector.
If P is the transition matrix, and v0 is the initial state vector, then the state vector after n steps is given by the formula:
|
Finally, we saw how long-term behavior of the system doesn't depend on the initial state (in most cases).
Register to view this lesson
Are you a student or a teacher?
Unlock Your Education
See for yourself why 30 million people use Study.com
Become a Study.com member and start learning now.
Become a MemberAlready a member? Log In
BackResources created by teachers for teachers
Over 30,000 video lessons
& teaching resources‐all
in one place.


I would definitely recommend Study.com to my colleagues. It’s like a teacher waved a magic wand and did the work for me. I feel like it’s a lifeline.
Jennifer B.
Teacher

Back

Markov Chain | Formula, Application & Examples Related Study Materials
Explore our library of over 88,000 lessons
Browse by subject