Read about phenotypic ratios and discover the difference between a phenotype and a genotype. Learn how to find phenotypic ratios using a Punnett square, and see phenotype ratio examples.
Phenotypic Ratio | Definition & Examples
Table of Contents
- What is a Phenotypic Ratio?
- How to Find a Phenotypic Ratio?
- Phenotype Ratio Example
- Incomplete Dominance & Other Complications
- Lesson Summary
Frequently Asked Questions
What does a phenotypic ratio of 1 1 mean?
A phenotypic ratio of 1:1 means that there are equal numbers of two phenotypes expected in the progeny of a cross.
What is phenotypic and genotypic ratio?
A phenotypic ratio is a numerical comparison of how many offspring will have one phenotype versus another. A genotypic ratio is a numerical comparison of the allele combinations the offspring will have, such as homozygous dominant, heterozygous, or homozygous recessive.
What is a phenotypic ratio example?
A phenotypic ratio example is 1:3. This means for every one organism that has the dominant phenotype in the offspring there will be three that have the recessive phenotype.
How do you find the phenotypic ratio?
To find a phenotypic ratio you first carry out a Punnett square to find the potential phenotypes of the offspring. You then use the numbers to create a ratio, such as 1:1 for the dominant phenotype to the recessive phenotype.
Table of Contents
- What is a Phenotypic Ratio?
- How to Find a Phenotypic Ratio?
- Phenotype Ratio Example
- Incomplete Dominance & Other Complications
- Lesson Summary
The phenotypic ratio definition is the ratio of different phenotypes present in the offspring of a cross. Ratios are numerical comparisons. For example, if someone had three apples and two oranges, the ratio of apples to oranges would be 3:2. Another example of a ratio is the number of servings of pasta inside one box, or the number of fish per unit area of the ocean. Phenotype is the observable traits of an organism, such as skin color, protein structure, or behavior.
Phenotype and Genotype
Phenotype is the observable traits of an organism. Phenotypes can be visible, such as skin color or eye color. But they can also be molecular and observable through experiments, such as protein structure or function. Phenotypes can also include behavioral traits such as reproductive strategies, parenting or aggression.
A genotype is the genetic makeup of an organism. Genotype is determined by the genes an organism inherits. Most animals are diploid, meaning they have two copies of each chromosome, one from the maternal parent and one from the paternal parent. Thus, organisms get two copies of each gene, and these copies are called alleles. The combination of alleles that an organism inherits produces the phenotype of a trait.
Many genes are inherited in a dominant and recessive pattern. This means that the dominant allele masks the other allele. Thus, if an organism gets two copies of the dominant allele, called homozygous dominant, or one copy of the dominant allele and one copy of the recessive allele, called heterozygous, the organism will display the dominant phenotype. The only way for organisms to display the recessive trait in this case is to inherit two recessive alleles, called homozygous recessive.

Your next lesson will play in
10 seconds
To find a phenotypic ratio, an investigator usually uses a Punnett square. A Punnett square is a diagram that helps scientists predict the genotype and phenotype of offspring from a cross. Using a Punnett square requires the following steps:
- Start by drawing a square. Then, divide that square into four equal sections by drawing two lines through the middle. You should have four small squares.
- Write the genotypic information from either parent on the top of the square, with a letter representing each allele on top of each box.
- Repeat that process by adding the other parent's genetic information on the left side of the square.
- Fill in the parents' genotypic information into the four boxes by filling them out down and across.
- The resulting four boxes are the potential genotypes of the offspring
- Lastly, figure out the phenotypes of each of the offspring. Remember, in a dominant and recessive inheritance pattern heterozygotes and homozygous dominant individuals will have the same phenotype.
- The phenotypic ratio is usually written as the number of individuals with the dominant phenotype to the number of individuals with the recessive phenotype.
For example, a phenotypic ratio where two of the boxes were heterozygous and two were homozygous recessive would be 2:2, which can be reduced to 1:1. In this example there are equal numbers of individuals with the dominant phenotype and recessive phenotype in the offspring. Another possible ratio is 1:3, where one organism has the dominant phenotype and three have the recessive.
Scientists can also record the genotypic ratio, where the genotypes of homozygous dominant, heterozygous and homozygous recessive are recorded. In this case, there may be three numbers in the ratio, such as 1:2:1.
To understand phenotypic ratios better, let's look at an example. There are two dogs that are heterozygous for black coat color. In this breed, black fur is dominant to white fur. Thus, heterozygous dogs and homozygous dominant dogs have the same phenotype of black fur and homozygous recessive individuals have white fur. A cross occurs between two heterozygous dogs, what is the phenotypic ratio of the offspring?
- First, set up the Punnett square with four boxes
- Next, arrange the parental genotypes on the top and left side of the box. Since both parents are heterozygous they will get one dominant allele, represented by a capital "A" and one recessive allele, represented by a lower case "a". Any letter can be used to represent the alleles, but they should be the same for any particular gene. The capital letter designates a dominant allele and a lower case designates a recessive allele.
- Next fill in the alleles down and across to form the progeny's genotype.
- Next, assess the phenotypes for each offspring. Offspring that have a heterozygous or homozygous dominant genotype have the dominant phenotype and offspring that have the homozygous recessive genotype have the recessive phenotype.
 |
What is the Phenotypic Ratio of the Offspring?
Identify the phenotypic ratio of the offspring from the example above. Your ratio should be set up with the number of organisms that have the dominant phenotype to the number of organisms that have the recessive phenotype, with the numbers reduced as much as possible.
In the example above, the phenotypic ratio is 3:1. There is one offspring that has a homozygous dominant genotype and two that have a heterozygous genotype. This means that three offspring will have a dominant phenotype. Then, there is one offspring that will have a recessive genotype, and thus the recessive phenotype. Thus, the overall ratio of dominant to recessive phenotypes is 3:1.
The use of a simple Punnett square to identify a phenotypic ratio can have complications. The first complication is incomplete dominance. Incomplete dominance is an inheritance pattern where the two alleles blend to make a unique phenotype in the heterozygous offspring. An example of incomplete dominance is flower color in snapdragons. Snapdragons that get two alleles for red color have red flower and snapdragons that get two alleles for white color have white flowers. Heterozygous snapdragons get one allele for red and one allele for white. However, red is not dominant to white. Thus, heterozygous flowers have a pink color.
 |
This can create different expected ratios in the offspring for two parents. For example, two heterozygous parents for a trait that has a dominant recessive pattern usually produce offspring with a 3:1 ratio of dominant to recessive phenotype. But, when two heterozygous parents have a trait that is inherited through incomplete dominance the offspring will have a ratio of 1:2:1 since there are three potential phenotypes.
Other types of inheritance patterns can also cause complications in predicting the phenotypic ratios in a Punnett square. For example, there is also sex-linked inheritance where genes are inherited on sex chromosomes, and co-dominance where both alleles are expressed equally in the heterozygote.
A phenotypic ratio is the numerical comparison of the different phenotypes in the offspring in genetics. A ratio is a comparison of two numbers, such as the number of black mice compared to white, the number of servings of pasta in a box, or the number of fish per unit area in the ocean. A phenotype is an observable trait in an organism, such as physical appearance, behavior, or molecular structures. The genotype is the combination of alleles that an organism inherits, such as homozygous dominant, heterozygous, or homozygous recessive. To find the phenotypic ratio of the offspring, scientists use a genetic tool called a Punnett square. To use a Punnett square, the following steps are needed:
- Draw a box and divide it into four smaller boxes
- Write the genotypes of the parents along the top two boxes and the left two boxes
- Fill in the genotypes down and across
- Assess which offspring will have which phenotypes
- Write the phenotypes as a ratio of dominant phenotype to the recessive phenotype
Phenotypic ratios are predictable when the gene is inherited in a dominant recessive pattern, where one allele covers up or masks the other. However, there are also additional inheritance patterns which can complicate the phenotypic ratio, such as incomplete dominance, co-dominance, and sex-linked inheritance.
Video Transcript
Feathered Friends
A friend of mine recently purchased some chickens. I'm not sure what type of chicken he bought, but I know his intention is to collect and sell their eggs. Hopefully, this earns him a few dollars. I suppose his purchase means we live in a fairly rural community, which is perfectly acceptable. Sometimes, rural communities are the best places to study biology. Yet, despite our location and my love of biology, I have no desire to own chickens or collect eggs. When it comes to farm animals I'm more about reading and less about doing. But, I can see their usefulness in scientific studies. For example, take a look at the chickens in this picture:
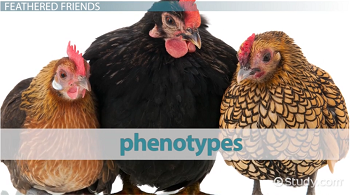 |
Notice how all three chickens have different phenotypes. A phenotype represents one of the physical characteristics of an organism. In this example, each chicken displays a different phenotype for feather color.
Physical Appearances
Phenotype is a common term in genetic studies. It's often associated with Punnett squares. Punnett squares are diagrams used to assist people in determining the phenotypes of a genetic cross. For example, suppose you allow two black chickens to breed. A Punnett square could help predict the likelihood of producing offspring with a specific phenotype. Here is an example to guide you:
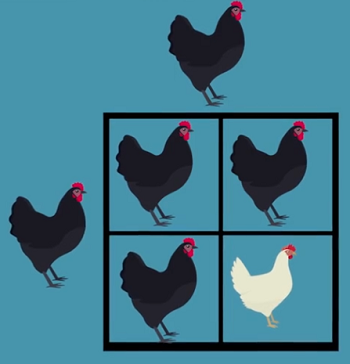 |
For the purposes of this lesson, you needn't worry about why the offspring appear as they do. Instead, focus on the end result. Notice that there are three black offspring and one white offspring produced. So, in genetic terms, you'd say these two black chickens have a 75% chance of producing black offspring, or a 25% chance of producing white offspring. That is the function of a Punnett square.
Ratios
Predictions made by the example Punnett square (feather color) were given in percentages. However, they could also be presented as a ratio. A ratio is a comparison between two numbers.
Ratios are everywhere. Consider baking a turkey in the oven for example. The time a turkey is cooked depends on the weight of the bird. Time and weight are both numerical values that are being compared. Hence, we're looking at a ratio. Or, consider the number of servings a box of macaroni contains. The number of servings compared to the one box is another ratio.
Remember that phenotypes are physical characteristics. When ratios are used to describe phenotypes it's called a phenotypic ratio. Phenotypic ratio is the number of one phenotype compared to another phenotype.
|
So, going back to our black chickens and their offspring, because there are three black-colored babies and one white-colored baby, we can write our phenotypic ratio as 3:1.
Lesson Summary
The physical appearance of an organism is called its phenotype. Phenotype varies within a population and is often analyzed during genetic studies. When comparing one phenotype to another, scientists use ratios. A ratio is a comparison between two numbers. When ratios are focused on physical characteristics, they are called phenotypic ratios. Phenotypic ratios compare two versions of a physical characteristic, such as coat color in mice. Punnett squares are diagrams used to assist people in determining the phenotypes of a genetic cross.
Register to view this lesson
Are you a student or a teacher?
Unlock Your Education
See for yourself why 30 million people use Study.com
Become a Study.com member and start learning now.
Become a MemberAlready a member? Log In
BackResources created by teachers for teachers
Over 30,000 video lessons
& teaching resources‐all
in one place.


I would definitely recommend Study.com to my colleagues. It’s like a teacher waved a magic wand and did the work for me. I feel like it’s a lifeline.
Jennifer B.
Teacher

Back

Phenotypic Ratio | Definition & Examples Related Study Materials
Explore our library of over 88,000 lessons
Browse by subject